
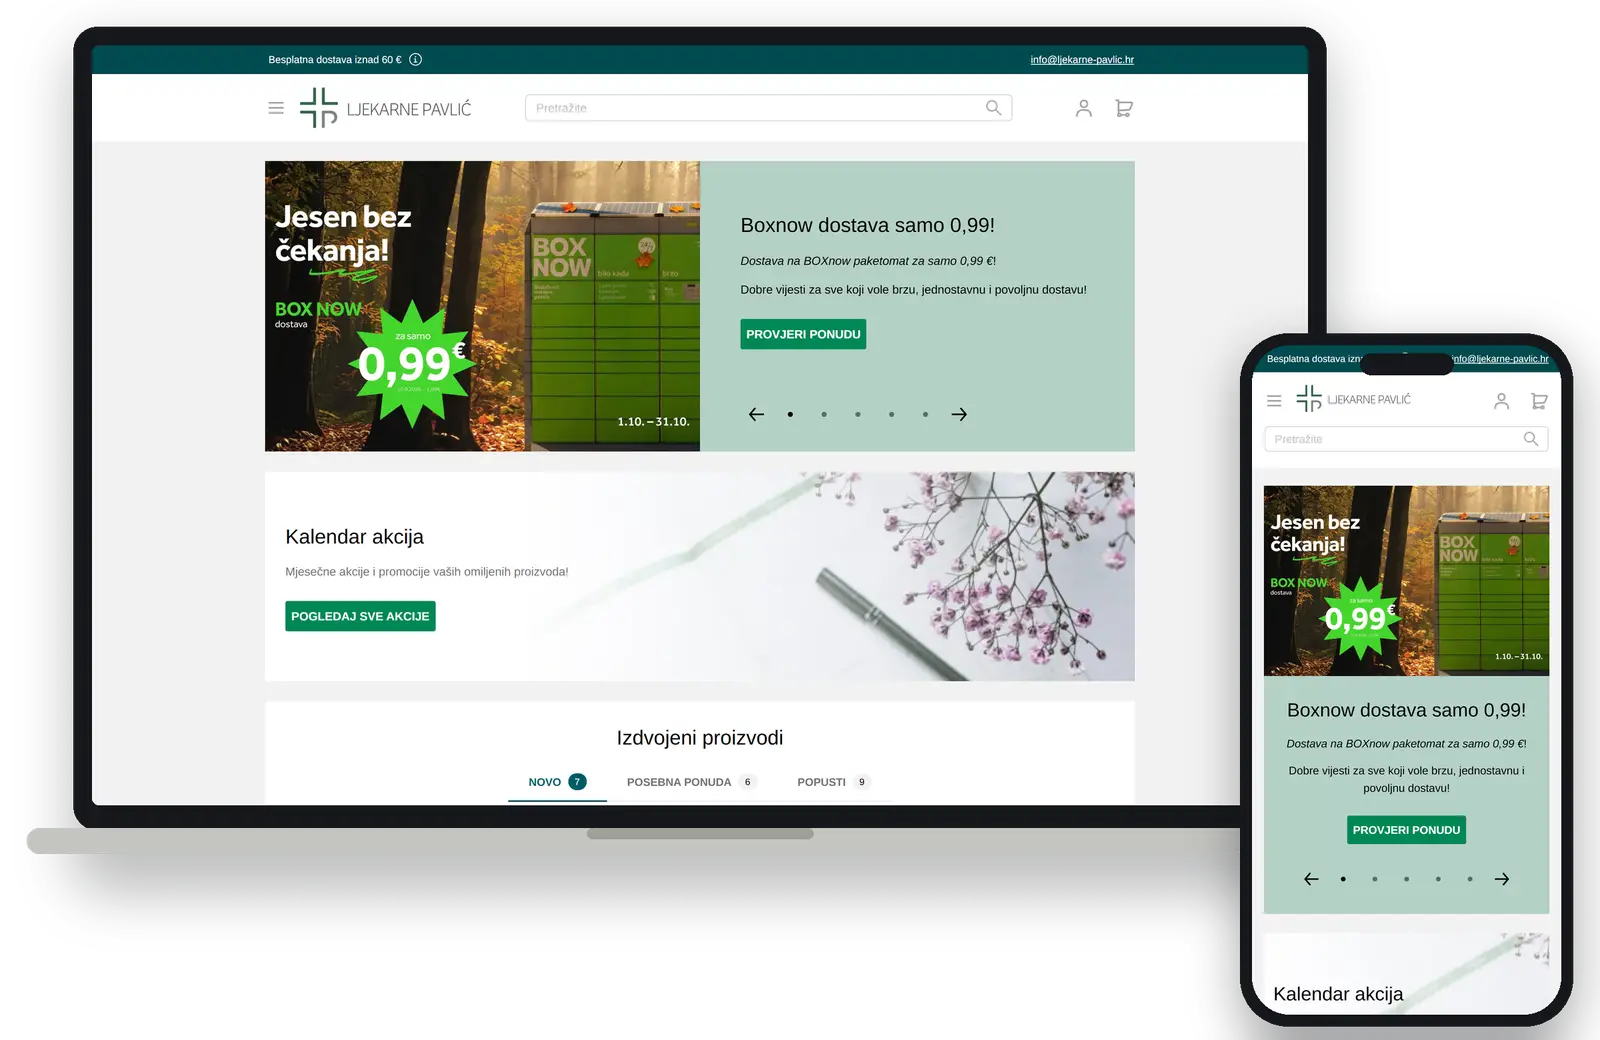
Between May 2024 and October 2026 we ran Google Ads, Meta campaigns and SEO for Ljekarne Pavlić, a Croatian pharmacy webshop. Monthly revenue from Google Ads grew by 178% compared with April 2024, while the return on ad spend stayed at around 18×. Here is what actually made the difference — in the order we did it.
1. We fixed the measurement before touching the ads
When we started, the cookie banner did not meet the new GDPR consent rules. Google Analytics was silently missing a large share of visits, and Search Console was not connected to Analytics. For months, the reports showed traffic collapsing when it wasn’t.
Scaling a budget on numbers like that is guesswork. So the first job was boring and essential: a compliant consent setup, Google Analytics 4 e-commerce tracking and a connected Search Console. Only then could we trust a single ROAS figure.
2. We picked an honest baseline
Because tracking was broken from May to roughly October 2024, those months could not be used for comparisons — they would have made every result look better than it was. We compare everything with April 2024, the last month that was measured correctly before we started.
If a baseline flatters you, a client will find out. Pick the one that would survive an audit.
3. Performance Max, scaled only as fast as the return allowed
In September 2024 we moved from small Search and Smart campaigns to Performance Max. From there we raised the budget step by step, and only when the return held. Over the last twelve months ad spend was about 2.8× the April 2024 level — and revenue from Google Ads was 178% higher, with ROAS around 18× throughout.
4. Then we cut the budget on purpose
In spring 2026 we deliberately reduced spend. From April to August, ad spend was 43% lower than in the same months of 2025. Google Ads revenue stayed within 5% of the previous year, and ROAS rose from 14× to 23×.
Scaling is only half of the job. Knowing where the extra euro stops paying back is the other half.
5. SEO in the background
Alongside the ads, technical and on-page work moved the shop’s average position across all search queries from 12.3 to 7.0 between June 2025 and September 2026 — from the second page of results to the first.
What we would tell any webshop
- Fix tracking first. Consent, GA4 e-commerce and Search Console before any budget decision.
- Choose a baseline you can defend. Never compare against months with broken data.
- Scale with a brake. Raise budget in steps and watch ROAS, not just revenue.
- Test cutting, too. Lower spend can keep revenue and raise efficiency.
The full numbers, charts and method are in the Ljekarne Pavlić case study. If you want the same approach for your shop, start a project.